R package:blupADC-功能 5
目录
简介
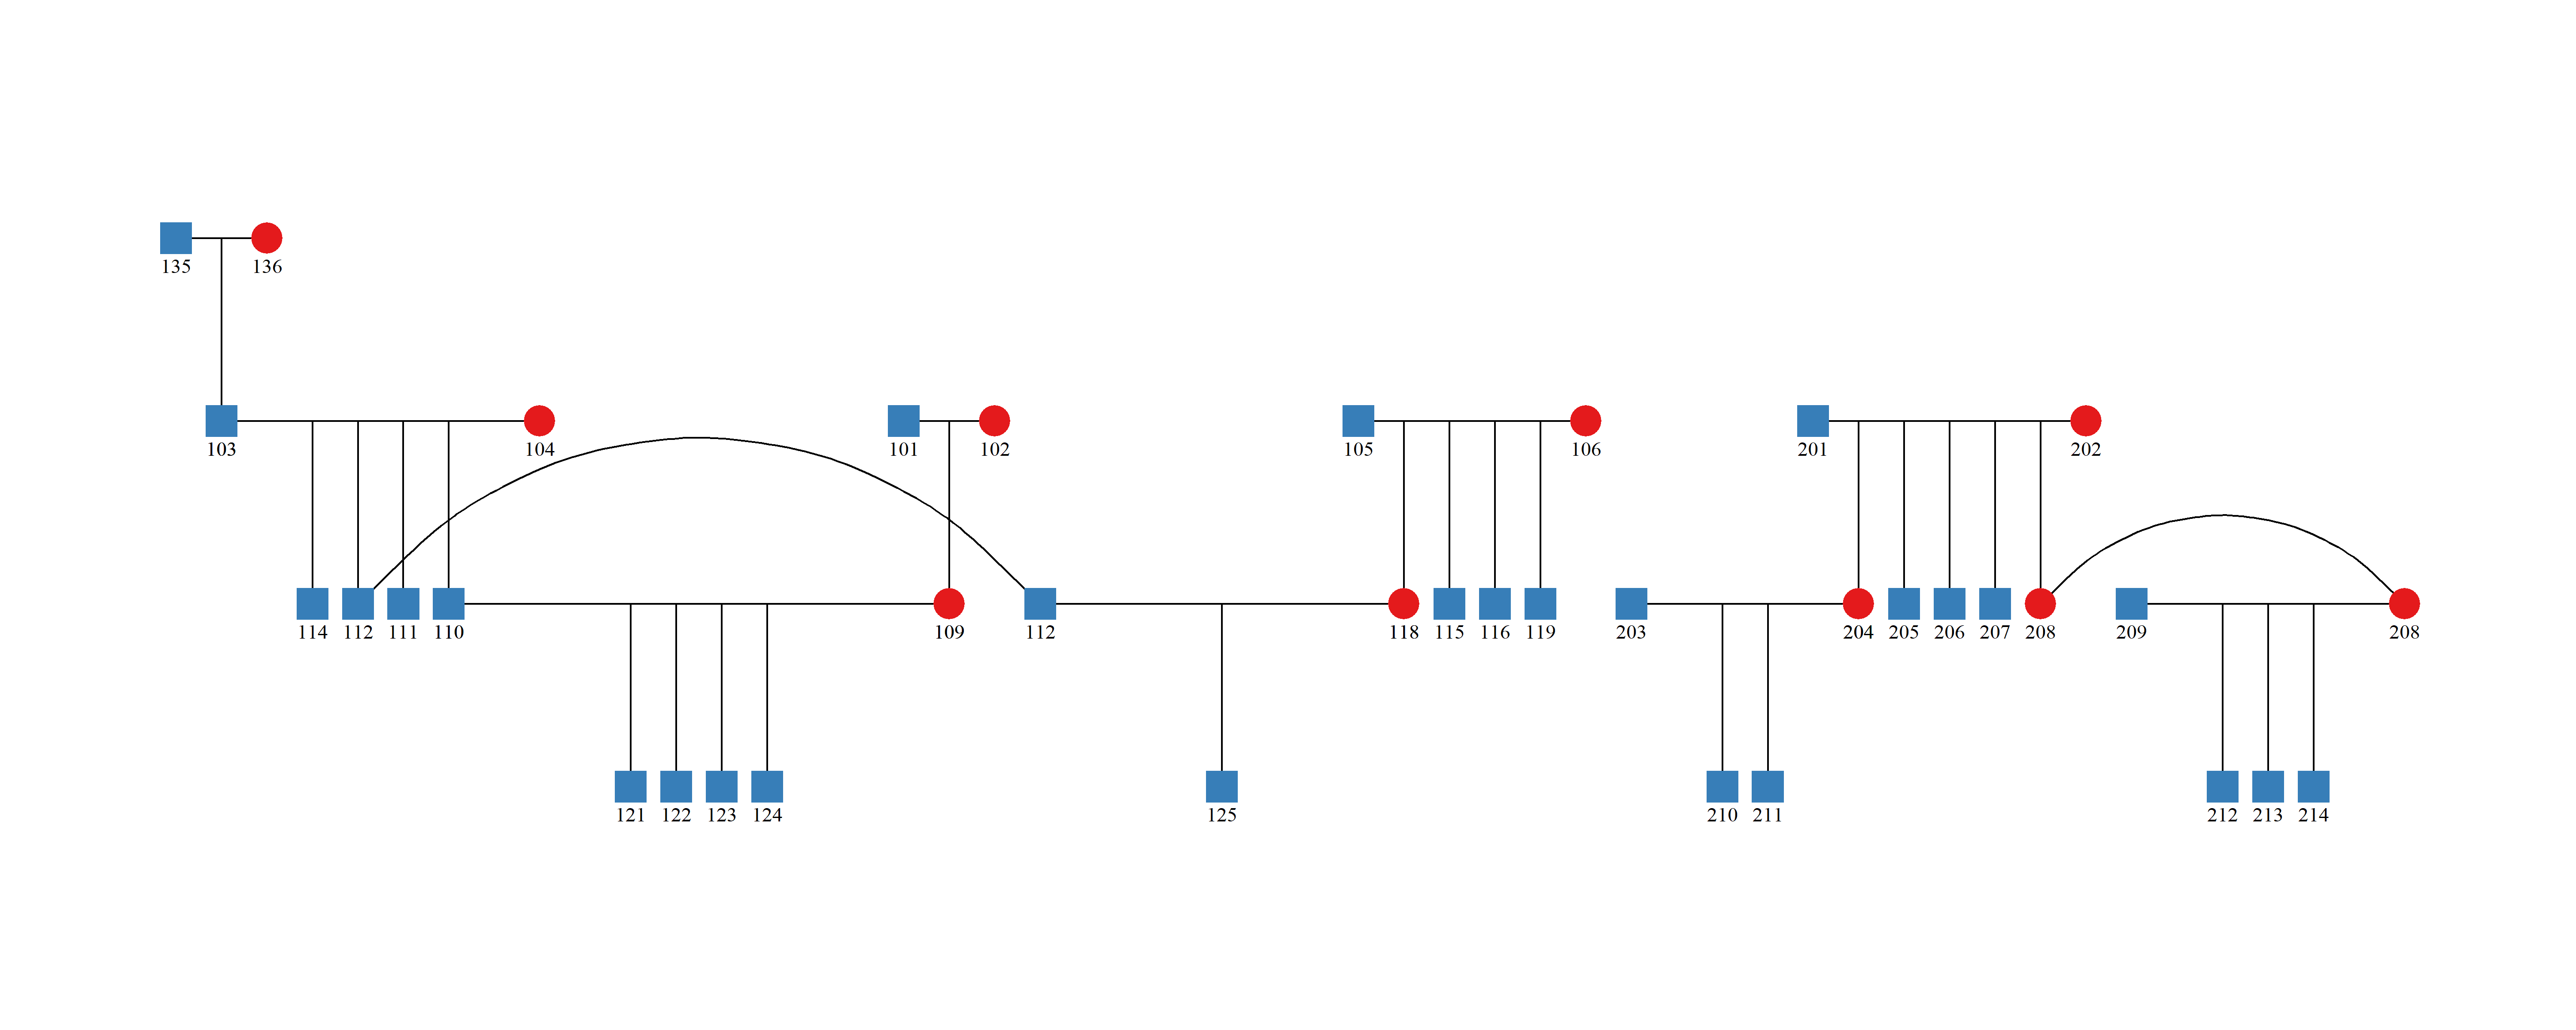
🦄 一个直观和清楚的系谱结构图能够帮助育种家和研究者做出更好的育种规划。通过使用 ggped 函数, 用户即能非常简单的绘制出所需的系谱图。
示例
绘制系谱中所有个体
library(blupADC)
pedigree_result=ggped(
                input_pedigree=example_ped2
                )
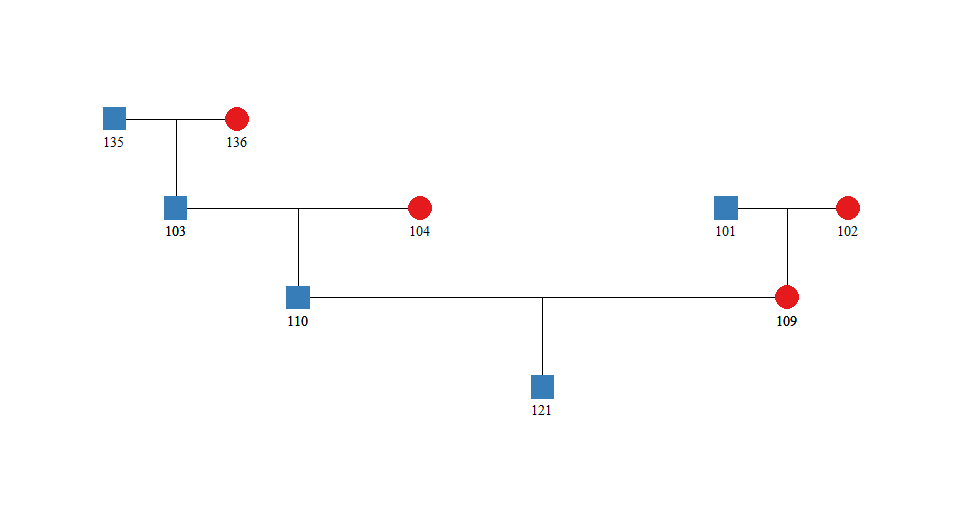
绘制系谱中的子集
library(blupADC)
pedigree_result=ggped(
                input_pedigree=example_ped2,
    			trace_id=c("121")             #provided subset-id
                )
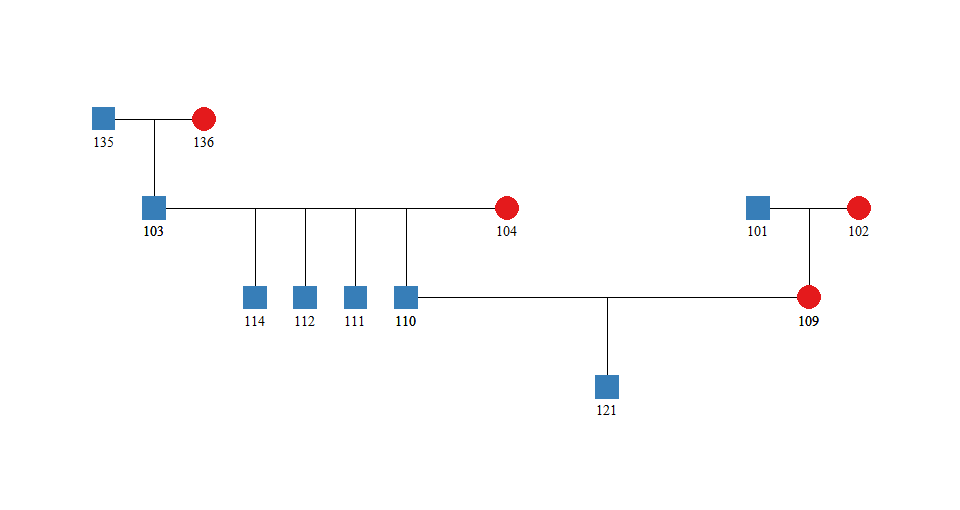
绘制系谱中的子集 (考虑子集的同胞)
library(blupADC)
pedigree_result=ggped(
                input_pedigree=example_ped2,
    			trace_id=c("121"),
    			trace_sibs=TRUE   #whether plot the sibs of subset-id
                )
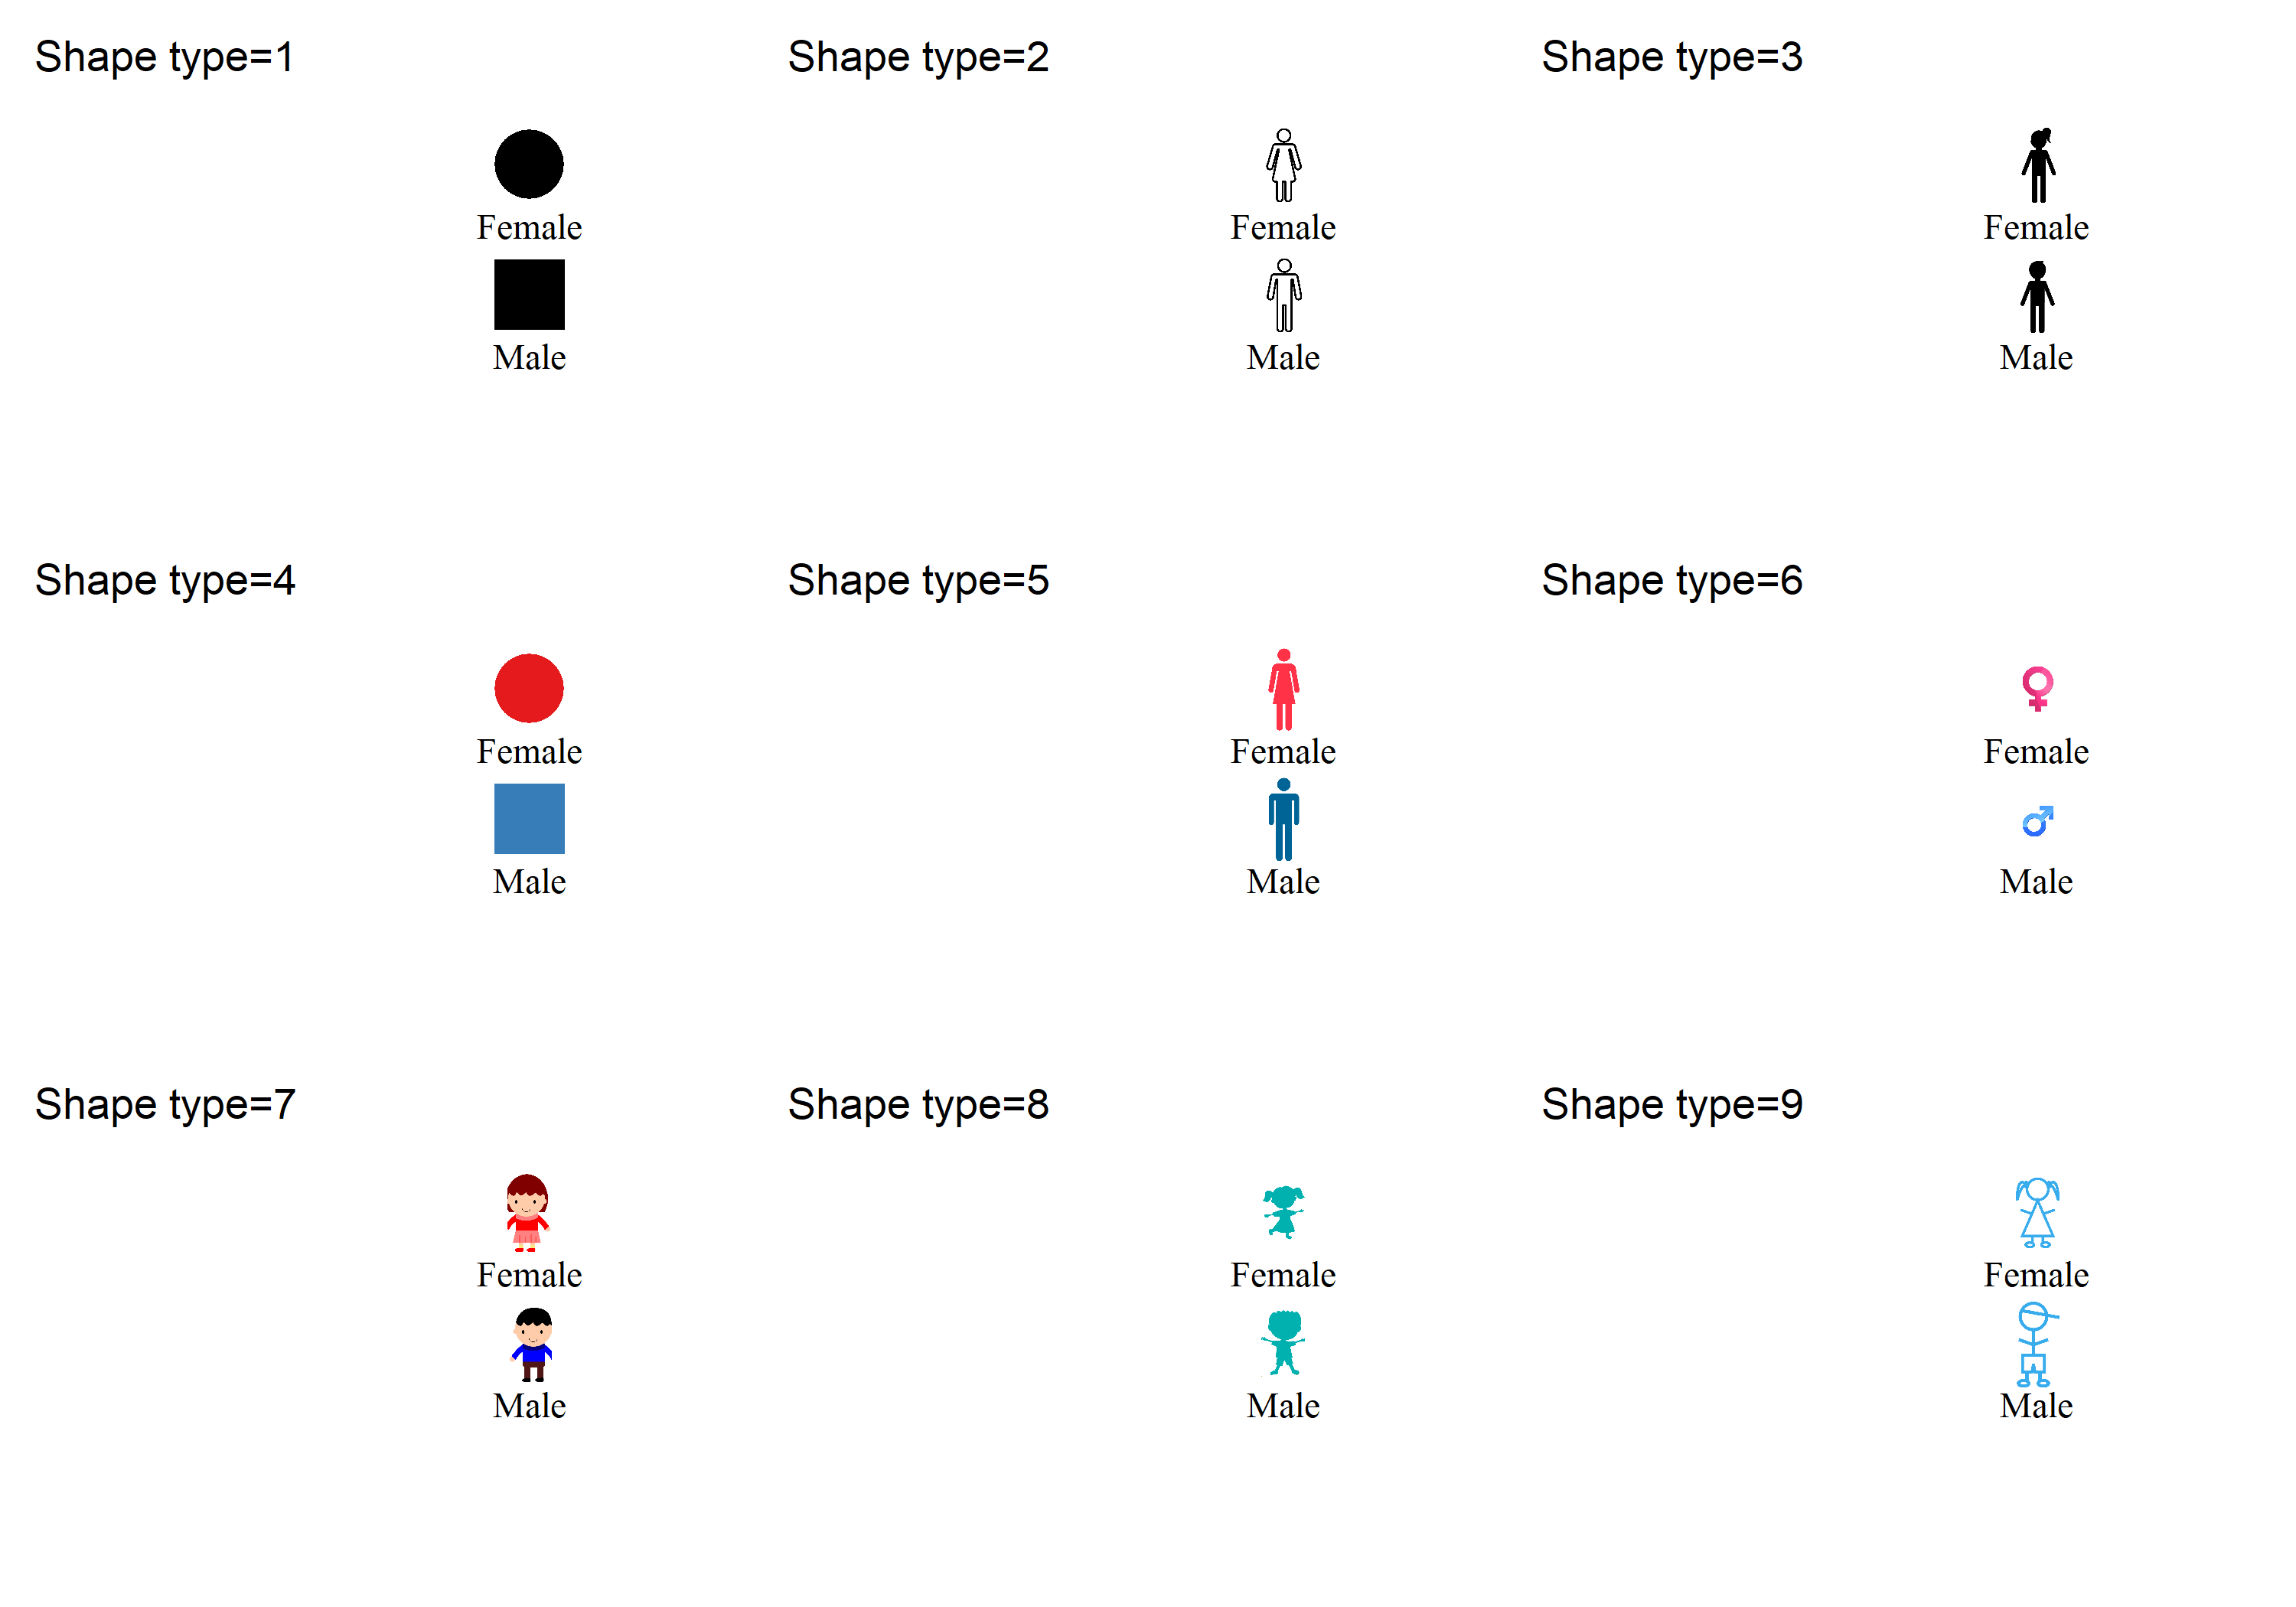
系谱图的样式
通过修改shape_type参数, 用户即可改变系谱图的样式。默认的 shape_type 为 4。
参数详解
💥基础参数
- 参数1:input_pedigree
用户提供的系谱数据, data.frame 或者 matrix 类型.
💌提供的系谱数据类型应为3列如下的3列结构:
| Offspring | Sire | Dam |
|---|---|---|
| DD19575312 | DD18768902 | DD16376015 |
| DD19513112 | DD18768902 | DD17111017 |
| DD20348012 | DD19132207 | DD19234510 |
| DD20361110 | DD19331001 | DD19293112 |
| DD20471212 | DD19331001 | DD19320808 |
| DD20564818 | DD19331001 | DD19311009 |
- **参数2: trace_id **
追溯子集的系谱, character 类型. 默认为 NULL (绘制系谱中所有个体)
- 参数3: trace_sibs
追溯子集的系谱过程中,是否追溯子集的同胞 , logical 类型. 默认为 FALSE .
- **参数4: ind_sex **
个体的性别记录 , data.frame 类型.
数据格式如下:
| Individual | Sex |
|---|---|
| 101 | Male |
| 102 | Female |
| 103 | Male |
| 104 | Female |
- **参数5:plot_family **
绘制系谱过程中,是否划分家系结构,logical 类型. 默认为 FALSE .
- **参数6:shape_type **
系谱图的样式,numeric 类型. 默认为 4.
💨进阶参数
- 参数7: shape_size
系谱图的大小, numeric 类型. 默认为 8 .
- 参数8:ind_text_size
个体名称的文本大小, numeric 类型. 默认为 4` .
- 参数9:ind_text_vjust
个体名称的文本垂直距离, numeric 类型. 默认为 3 .
梅全顺
博士后
My research interests include genomic selection and machine learning in animal breeding.